Modelling Item Worth Based on Rankings
Heather Turner, Freelance/University of Warwick, UK
Jacob van Etten, Bioversity International, Costa Rica
David Firth, University of Warwick/Alan Turing Institute, UK
Ioannis Kosmidis, University of Warwick/Alan Turing Institute, UK
Heather Turner, Freelance/University of Warwick, UK
Jacob van Etten, Bioversity International, Costa Rica
David Firth, University of Warwick/Alan Turing Institute, UK
Ioannis Kosmidis, University of Warwick/Alan Turing Institute, UK
May 15 2018
Rankings
Rankings arise in a number of settings
- Finishing order in a set of races
- Consumer preferences in market research
What is the worth of each item?
Luce’s Axiom
Probability of choosing item A over item B unaffected by other items
Suppose we have a set of J items
S={i1,i2,…,iJ}
Then under Luce’s axiom
P(j|S)=αj∑i∈Sαi
where αi represents the worth of item i.
Plackett-Luce Model
Consider a ranking of J items as a sequence of choices.
The Plackett-Luce model is then
P(i1≻…≻iJ)=J∏j=1αij∑i∈Ajαi
where Aj is the set of alternatives in choice j.
PlackettLuce can be used to fit this model.
Example 1: Netflix Data
Netflix released movie rankings for the Netflix Prize.
Using read.soc from PlackettLuce, we read in a set of rankings for 4 movies
library(PlackettLuce)
preflib <- "http://www.preflib.org/data/election/"
netflix <- read.soc(file.path(preflib,
                              "netflix/ED-00004-00000138.soc"))
head(netflix, 2)
# n Rank 1 Rank 2 Rank 3 Rank 4
# 1 68 2 1 4 3
# 2 53 1 2 4 3Convert to Rankings
PlackettLuce requires the rankings to give the rank per item vs. item per rank.
We convert the rankings using as.rankings, which creates a special data structure
R <- as.rankings(netflix[,-1], input = "ordering")
colnames(R) <- attr(netflix, "item")
print(R[1:3], width = 60)
# 1
# "Beverly Hills Cop > Mean Girls > Mission: Impossible II ..."
# 2
# "Mean Girls > Beverly Hills Cop > Mission: Impossible II ..."
# 3
# "Beverly Hills Cop > Mean Girls > The Mummy Returns > Mis ..."Fit Plackett-Luce Model
Now PlackettLuce can be used to fit the model, with frequencies as weights
mod <- PlackettLuce(R, weights = netflix$n)
coef(mod, log = FALSE)
# Mean Girls Beverly Hills Cop
# 0.2306 0.4511
# The Mummy Returns Mission: Impossible II
# 0.1685 0.1498These coefficients are the worth parameters and represent the probability that each movie is ranked first.
Inference
For inference it is better to work on the log scale. Comparison intervals can be computed via qvcalc.
qv <- qvcalc(mod)
plot(qv, ylab = "Worth (log)", main = NULL, cex = 1.5, pch = 19)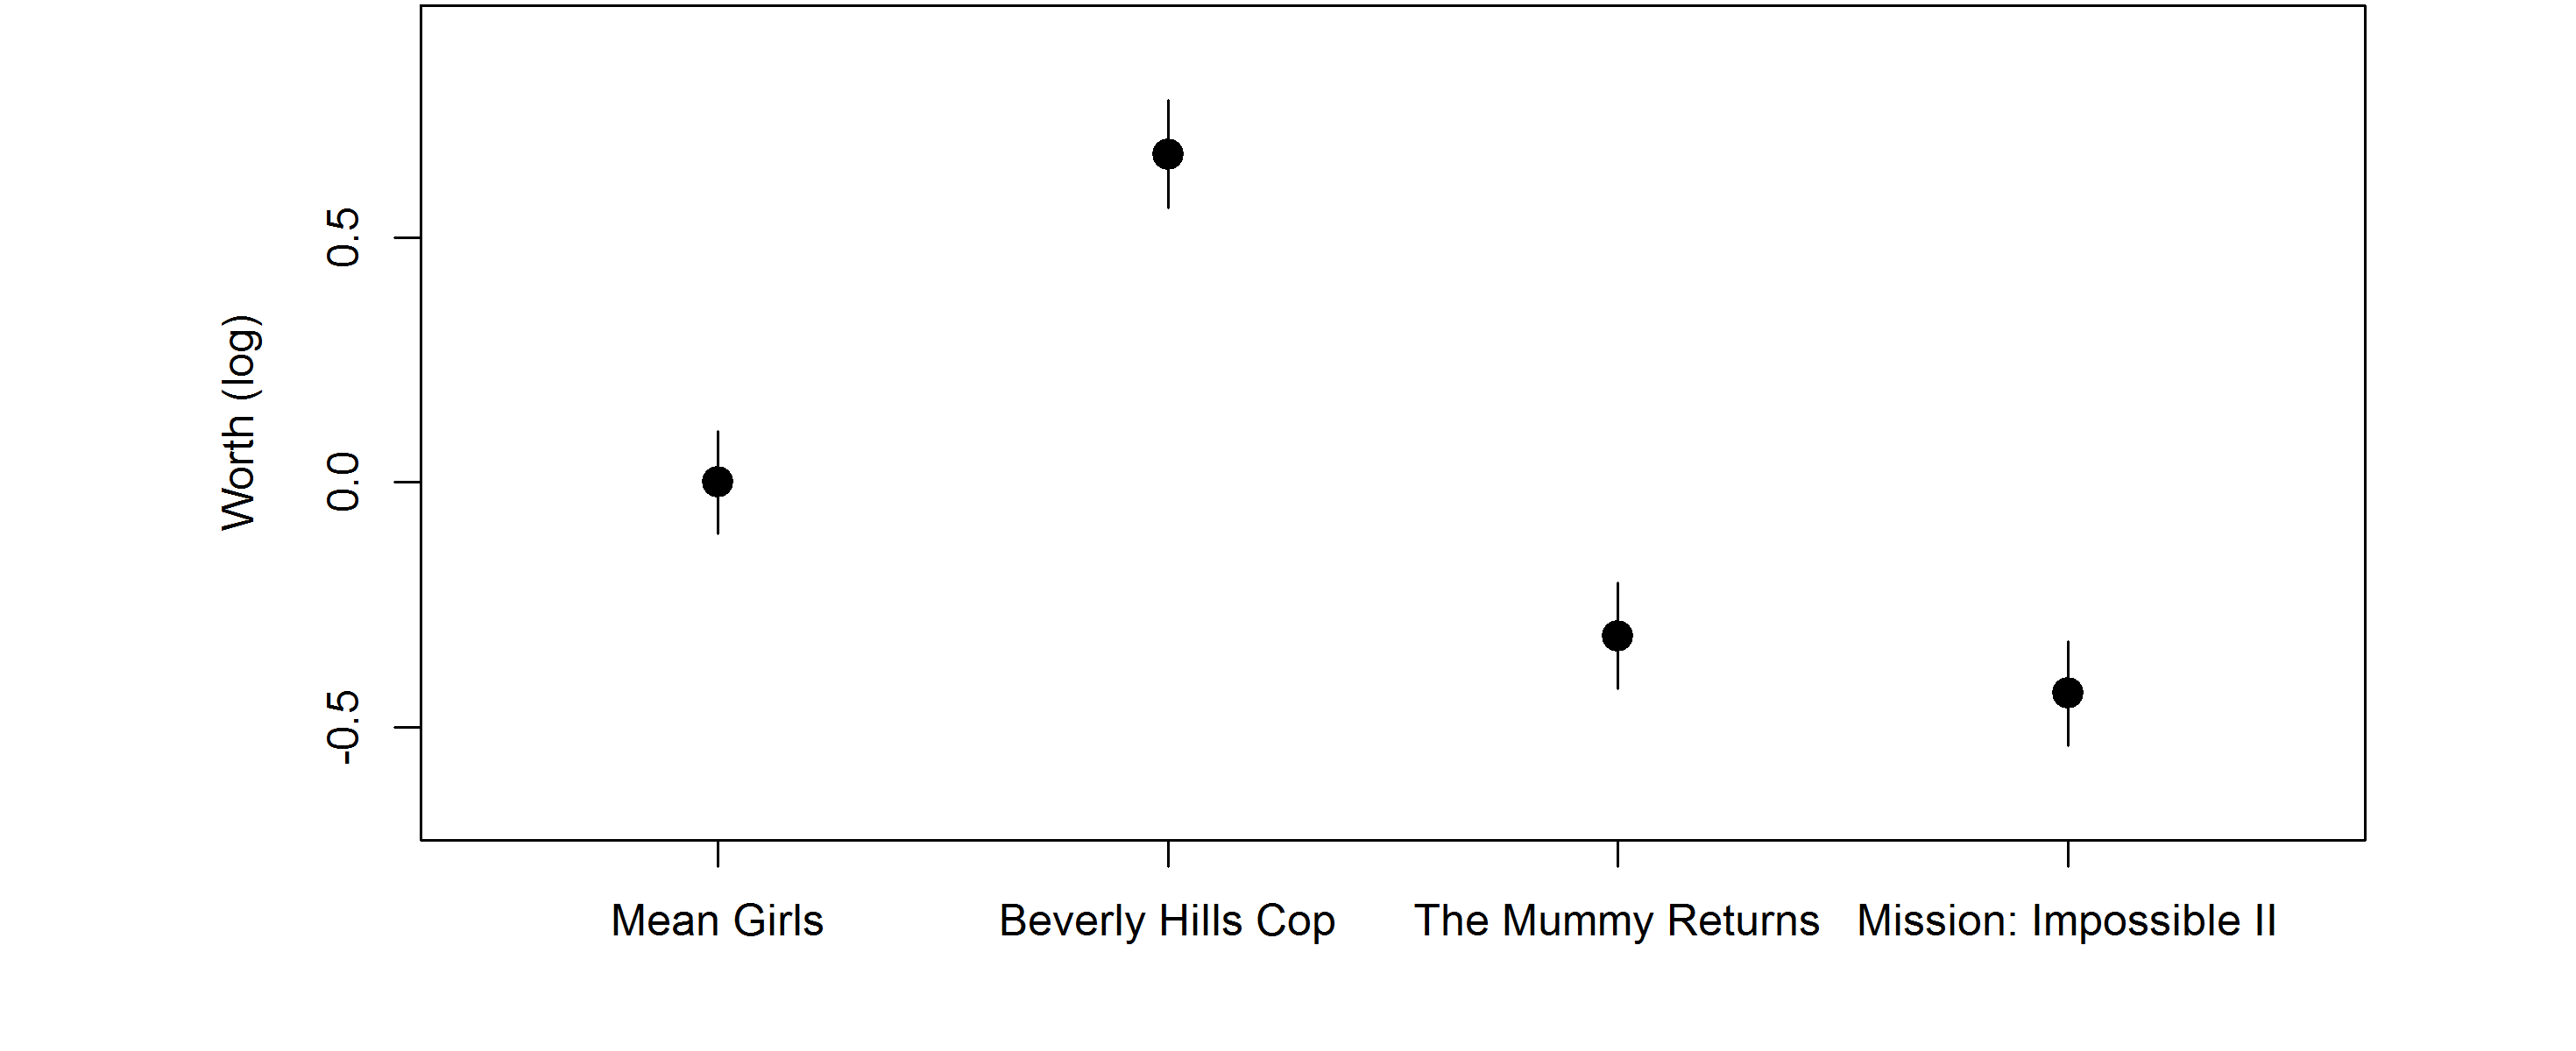
Ranking properties
The Netflix rankings are an example of strict, complete rankings.
In other applications we might have
- tied ranks
- incomplete rankings
- sub-rankings: only some items ranked each time
- top-n: only the top n items are ranked
PlackettLuce implements a generalized model which handles ties and sub-rankings.
Generalized Model
Now consider a ranking of sets C1≻C2≻…≻CJ.
The generalized model with ties up to order D is
J∏j=1f(Cj)∑min(Dj,D)k=1∑S∈(Ajk)f(S)
where
f(S)=δ|S|(∏i∈Sαi)1|S|
Ranking Networks
In some cases, the underlying network of wins and losses means the worth cannot be estimated by maximum likelihood.
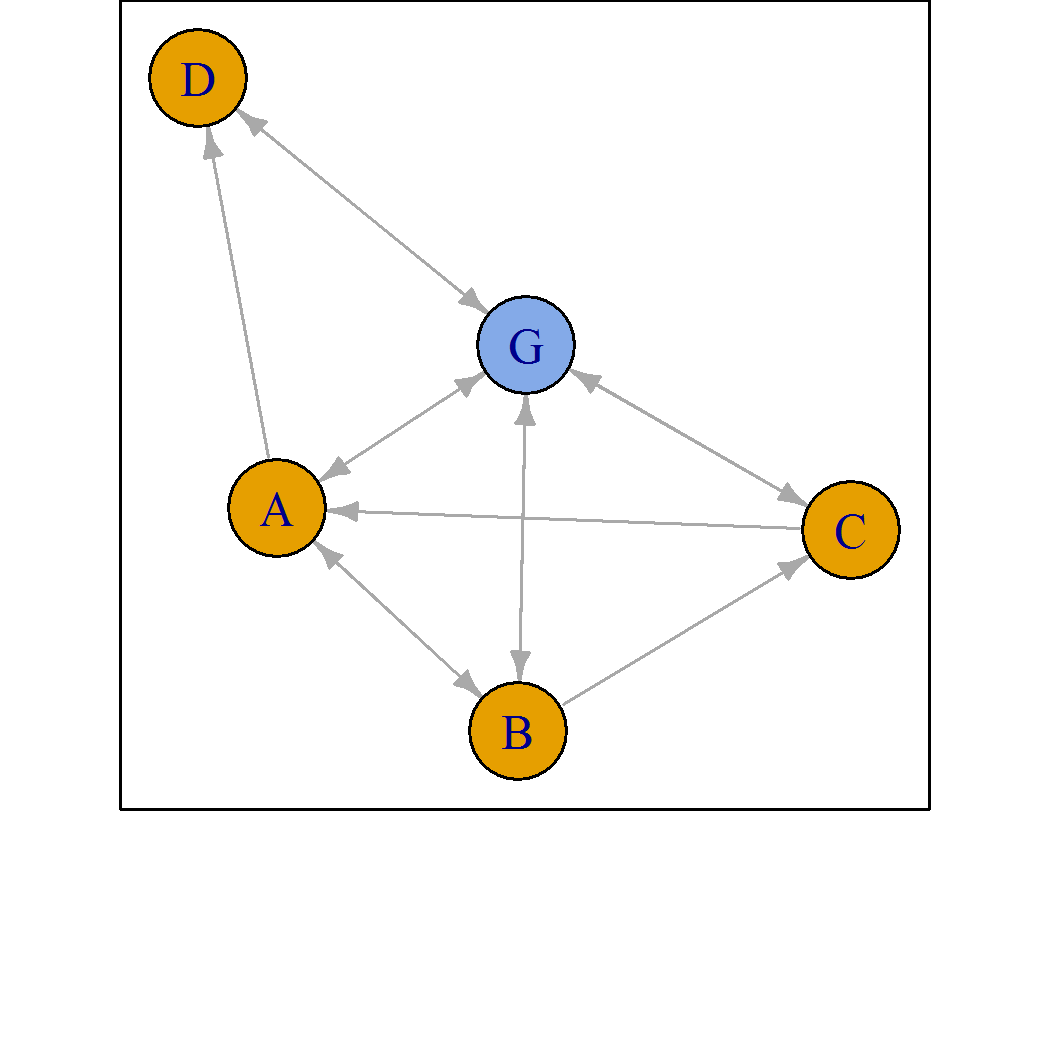
Pseudo-rankings
PlackettLuce connects the network by adding npseudo pseudo-rankings with a ghost item.
- The MLE is always estimable
- Can be viewed as a Bayesian prior
- Default
nspeudo = 0.5
Heterogeneity
The worth of items may vary with the ranking conditions, e.g. judge making the ranking.
PlackettLuce works with partykit to fit Plackett-Luce trees
- Fit Plackett-Luce to all the data.
- Test stability of worth parameters w.r.t. each covariate.
- If significant instability, split data by relevant covariate.
- Repeat 1-3 until no significant instability/split makes sub-group too small.
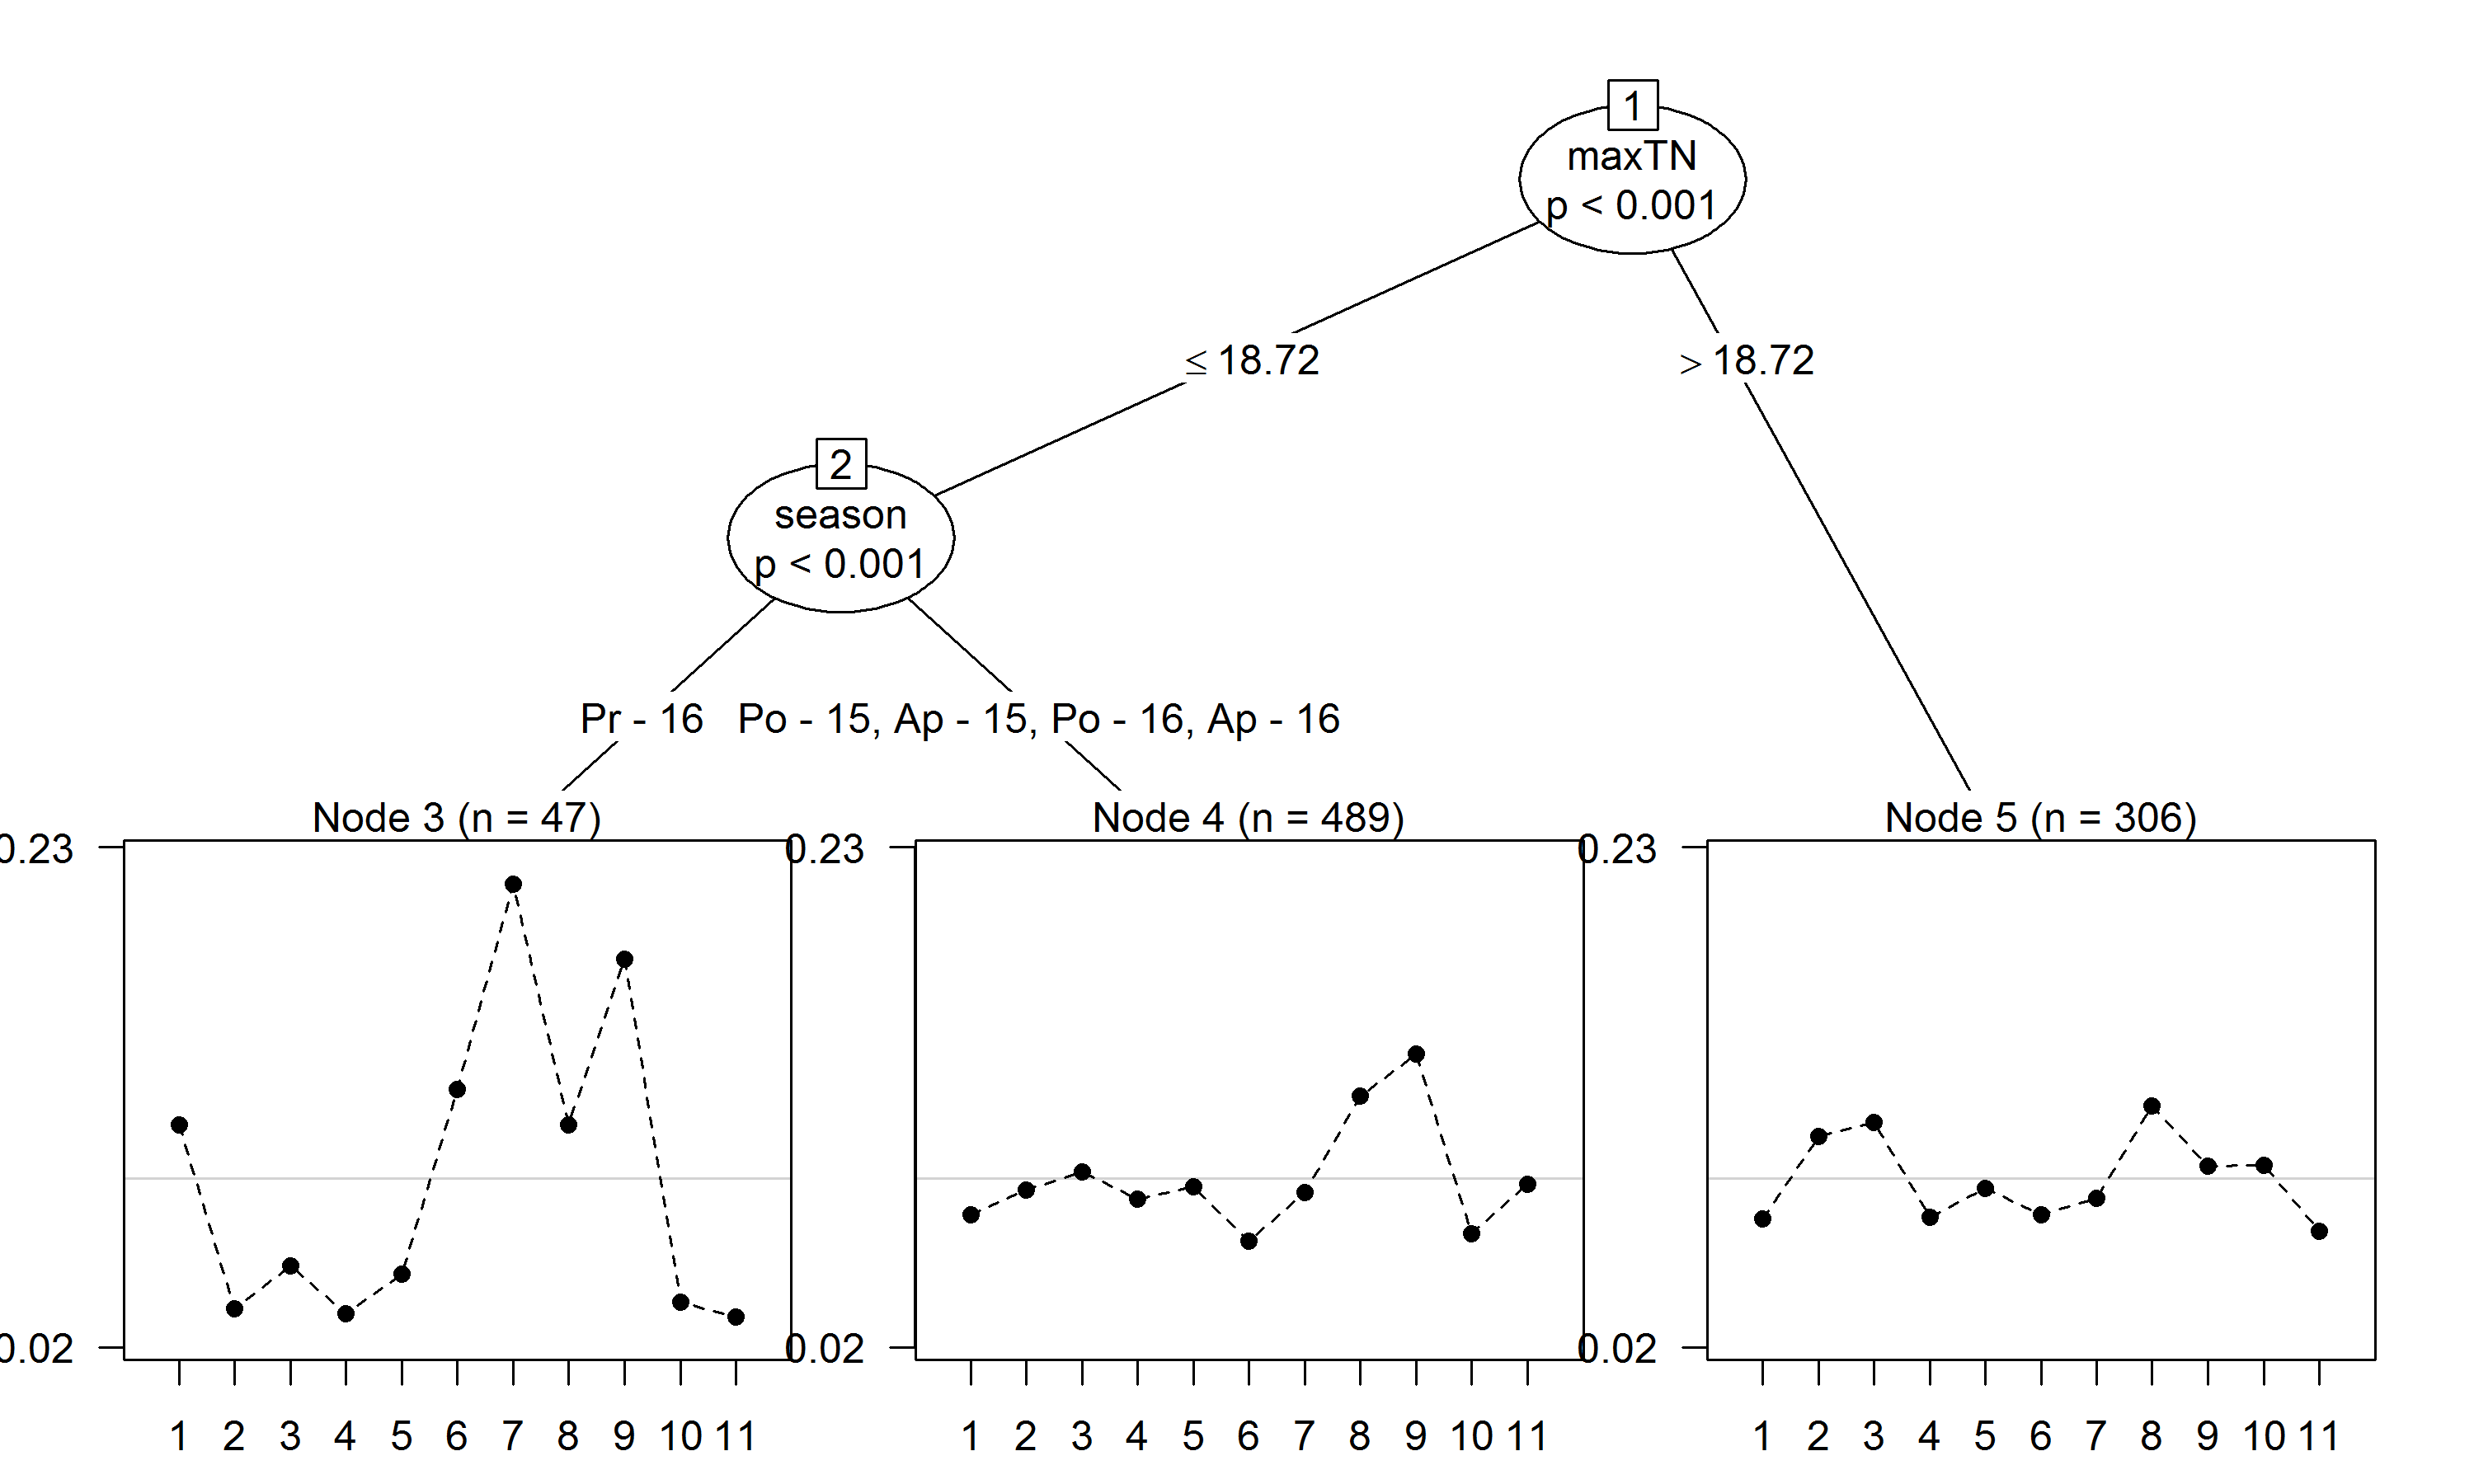
Example 2: Beans
A citizen science trial of bean varieties in Nicaragua:
- 11 bean varieties
- Each farmer grew 3 varieties
- Asked which was best and which was worst
- Asked to compare each to variety to local variety
- Covariates on growing conditions, including
- Growing season (Primera, Postrera, Apante)
- Year
- Maximum night-time temperature
Example 2: Beans
The example on ?beans tidies the original data
example("beans", package = "PlackettLuce", echo = FALSE)The original beans data frame has 842 rows: one per farm.
The 3-way and 2-way rankings are collated in a rankings object
R[1,]# [1] "PM2 Don Rey > SJC 730-79 > BRT 103-182"R[3368,]# [1] "Local > SJC 730-79"Plackett-Luce Tree
The rankings are grouped by farm
G <- grouped_rankings(R, rep(1:nrow(beans), 4))
format(head(G, 2), width = 50)
# 1
# "PM2 Don Rey > SJC 730-79 > BRT 103-182, Local > BRT 103-182, ..."
# 2
# "INTA Centro Sur > INTA Sequia > INTA Rojo, Local > INTA Rojo, ..."Use pltree with max depth 3 and ≥ 5% records in each group
beans$year <- factor(beans$year)
tree <- pltree(G ~ ., data = beans[c("season", "year", "maxTN")],
               minsize = 0.05*n, maxdepth = 3)
Plotting Tree
Summary
Future work
- Incorporating spatial effects
- Incorporating genotype information
More details
- PlackettLuce is on CRAN and GitHub
- Full details of the methods and further examples in the vignette